When Google makes an announcement, you know it’s worth listening to. And when Google adds a feature to the Play Console concerning user retention rates (and other notable features that were covered in a recent blog post), you know there’s a good reason!
The announcement worth listening to, in this case, is the greater emphasis being put on monetization of user engagement. In the weeks following the announcement, we’ve been seeing a rise in category rankings for numerous apps that put a notable effort into user engagement. User engagement is inherently linked to retention rates and, of course, the higher the retention rate is at the end of the month, the higher the probability that the app is utilizing its efforts properly.
This blog post sets to dive into the question of “what are good retention rates?”. This is a question brought up by several of our partners, and we thought it an idea worth exploring.
So, what are good retention rates?
First off, in order to provide some context, here is a screenshot of the latest addition to the developer console in terms of retention rates:
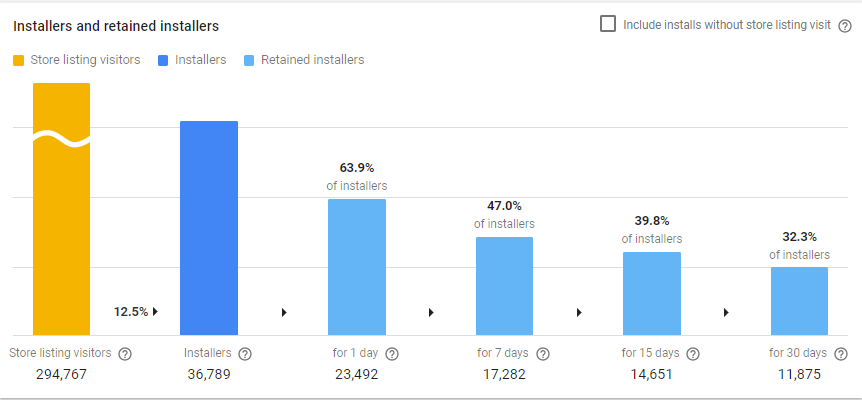
Shown here is a breakdown of retention rates for a week in May. This chart displays the percentage of installers who’ve retained their installs after 1 day, 7 days, 15 days and 30 days.
While retention rates are a crucial figure for an app’s success, they significantly vary between distinct categories and verticals. In order to make sense of it, we decided to analyze our findings twice – first by categories and then by strong brands vs. lesser-known apps. By doing so, we hope that our readers will gain a better understanding of what retention numbers they should aspire to, based on their app’s status.
Breakdown by Category
We’ve collected data from several apps of the following categories: Casino, Social and Casual Games.
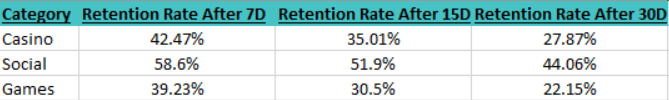
Unsurprisingly, the category with the highest retention rate is “Social”, with an average 30D retention rate of 44%. This means that almost half of the users who’ve downloaded social apps have kept them after 30 days – these apps are also less likely to be uninstalled after the 30-day mark. This stands in contrast to the “Games” category, which stands at a benchmark retention rate of 22% after 30 days, the lowest benchmark of the 3 categories.
Another interesting element we can conclude from the data is that the difference in retention rates between the 7-day benchmark and the 30-day benchmark is more or less the same for the Casino and Social categories (with an average of 29% loss in retention rates over the referred-to time span), while the “Games” category has a higher loss of retention rates at close to 45%. This suggests that, not only does the games category retain the smallest number of users after a 7-day period, but even users that have the app already installed on their phone, have a higher tendency to uninstall it in the coming weeks.
These numbers might lead us to believe that people who download an app with a clear agenda, such as playing casino games or communicating with their friends, are likely to hold onto the app they’ve downloaded, since they install it with the intent of making this agenda their own. Comparatively, a user who installs a general and casual game probably doesn’t have a clear plan in mind and is more likely to abandon the app after a week or two.
Breakdown by Brands
When we talk about brands, we refer to those we know the user is likely to search for by name, i.e. when a user searches for the term “Facebook” (unfortunately, not a client… yet ?), it is highly unlikely he/she will download a different app with similar features. Since the data we’ve collected is privileged information for the apps we partner with, we’ve simply accumulated the data and categorized them according to better and lesser known brands:
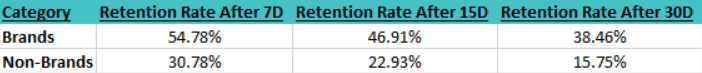
The data displayed in this table shows a significant difference in retention rates between brands and non-brands at all benchmarks (7D, 15D, 30D). While acquiring this data, we had expected to see inconsistent numbers in favor of the brand names, though we had not expected such discrepancies. The average retention rates for brands stands at 38% after 30 days, a fall of about 40% from the starting point of the 7D benchmark. On the contrary, the non-brands hold a retention rate of 15.7% after 30 days, a fall of over 50% from the initial 7D benchmark.
This is probably the result of a user “knowing what he/she wants”, meaning the users’ search of a specific brand will most likely result in the installation of the app. The retention rates also project the same idea, with a higher percentage of the initial installs retained after 30 days. When a user downloads a well-known app, he/she expects it to perform in a certain manner. On the other hand, when a user installs an app that was found through a general search, he/she does not necessarily know what to anticipate. All in all, this makes sense.
Concluding thoughts
Getting back to our initial question – what are good retention rates? We have gathered some numbers from different apps that will allow you to understand which numbers you can aspire to. Keep in mind that retention rate benchmarks vary in relation to where you stand. Are you a well-known brand name? Do you fall under the casino category? Once you have accurately classified yourself, check your status in relation to your category. Now check whether you are doing what you can in terms of monetization – this is a field in which brand names, understandably so, hold a strong position.
In addition, as previously stated, it seems to us that the reason brand names hold strong retention rates is the result of the app and the users’ expectations falling in line. We, of course, don’t expect new apps to become well-known brands overnight, but the conclusion we might draw from this post is: are you making sure your user knows exactly what he/she is getting? If the answer is anything but a whole-hearted “yes”, then you know there is some work to be done!