
Conversion optimization, or maximizing the chances that a user who was exposed to your app page installs the app, is a crucial part of ASO. Understanding which app page assets (icons, screenshots, descriptions etc.) encourage conversions will result in an increase in organic installs and a decrease in UA CPIs.
From a Social Science standpoint, online A/B testing is a form of consumer behavior research, in which we can predict how the average consumer would react towards our product.
There are numerous tools that are meant to assist app developers solve the puzzle of which app store assets will induce the most installs. In the following blog post, we will assess three types of such tools:
• Surveys
• Duplicated app store pages
• Google Play Experiments tool
Spoiler – we prefer the Google Play Experiments Tool and are generally not impressed with surveys.
In addition, we will review the theoretical science behind A/B tests.
Warning – part of this blog post will get (a bit) scientific.
Getting Down to the Nitty-Gritty – Some Core Research Methods Essentials
Each proper A/B test makes use of statistics. In the process of a statistical test, a hypothesis is proposed for the statistical relationship between the two data sets, and this is compared as an alternative to an idealized null hypothesis that suggests no relationship between two data sets.
What This Means in App Stores
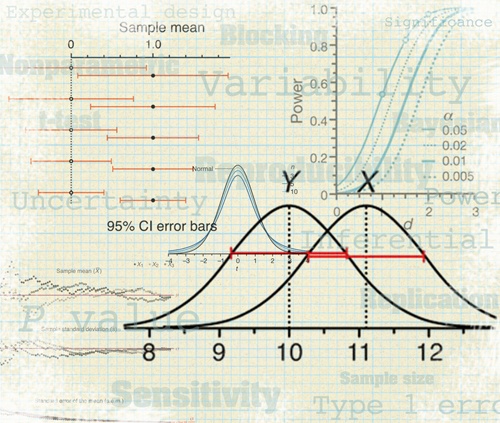
In an app store, the question might be whether there is a relationship between an icon the users see, and their willingness to install the app. If the results of the test are significant enough to see the effect, we conclude that there is an effect in the real world. In statistical language, this means that we reject the null hypothesis. In English, it means that one icon outperformed another, therefore X (the icon) correlates with Y (users’ willingness to install the app). The correlation might be positive or negative, meaning that the new icon might result in better or worse conversion rates.
Implementation
If the entire process was appropriate, we can implement the results of the test in the real world and assume that X correlates with Y with a high confidence level – a confidence level of over 0.9, which means that there is at least a 90% chance that the result in the real world will be similar to the result in the test.
Designing the Experiment
But what about the test? The test subjects? How do I choose the most accurate test method? In order to predict the right result, you simply need to follow some accepted statistical rules and some common sense. If you don’t follow these rules, then assuming something from the test results will also work in the real world may result in very serious implementation problems. One of the mistakes can lead to a bias (random or systematic) and interfere with the results. There are many mistakes that one can do, but we will focus on some of the trends that we noticed on the web, and in app store A/B tests in particular.
Common Testing Methods
Focus Group – Explicit Non-Blind Measures
Some companies use show – they present a focus group with several versions of screenshots and simply ask them which screenshot they liked best. Focus group participants choose their preferred option by answering surveys and commenting on what they think should be changed. Usually the focus group is incentivized to give answers – the more questions they answer, the more incentive they get.
Advantages:
1. Detailed feedback: In surveys, participants can provide feedback with their personal thoughts on how the subject can be made better. This presents a good “quality measure”, but a poor statistical one.
2. Full control: You decide exactly which questions each participant will be asked. Mostly, you would also be able to control the number of participants in your survey and how fast you get results.
Disadvantages and Risks:
While this method has its pros, it suffers from some severe downsides. Mostly, the method has “low external validity”, which means that results from this test cannot be safely applied to the real world. Following are a few reasons for that:
1. Surveyed sample does not resemble app users: Users answering your survey are likely very different than your app’s natural users, which means that the screenshots they prefer aren’t necessarily the screenshots your users prefer.
2. Not blind or double blind trials: This means that subjects are aware of the fact they’re being tested. If the subject knows he or she is being tested, it may change that subject’s natural behavior in one way or another. This can lead to a bias and, ultimately, to wrong assumptions from the test on the real world.
3. Incentives: When the test subject is being paid in one way or another, it can lead to a non-neutral response on the test, and therefore to a bias, which can lead to wrong assumptions on the real world.
4. Wrong research question: In surveys, users answer which design they like best, which one is the prettiest, etc. However, as any online marketer will tell you, best designs do not necessarily induce conversions. So, the very question in this kind of survey is wrong.
Replicated App Pages – A/B Testing
Third party solutions such as StoreMaven or SplitMetrics present a much better, yet not problem-free solution.
What these platforms do is create a web page that is an exact replica of the app page, so that users are not aware of the fact they’re not in the actual app store. Since it is essentially a web page, it can be fully tracked and controlled. Thus, an A/B test can be executed. This method only works with paid traffic.
Once users click on an ad, they will be directed to the replica app page. At this point, traffic splits in two: to the A page or to the B page. The page that yields the highest conversion rate prevails. When users click on the install button, they will then be transferred to the actual app page, at which point they will be able to actually install the app. This is a much cleaner, more eligible way of testing.
Advantages:
1. Asking the right question: Unlike the surveys method, in this case users are not asked which screenshot they prefer, but are being observed to see which version induces more installs.
2. Double blind trials: The subject doesn’t know he or she is being tested and the tester is the software, which cannot be biased.
3. Detailed information: Since this is essentially a web page, any user activity can be tracked and analyzed. Questions such as “how many screenshots does a user view” or “how many users read the description” suddenly have answers.
4. Best solution for iOS: This is the only and best solution applicable for iOS.
Disadvantages and Risks:
1. Costly: There are two kind of costs to this service. One is what you pay the platform itself, but the more significant one is the traffic you send. A large amount of this traffic will go to waste as users who click on “install” in the replicated page are surprisingly redirected from the fake app page and are bound to get “scared” and not install the app.
2. Sample differs from population: Usually only users from one source of paid traffic will be tested, and organic traffic will never be tested. There is no guarantee that users from your sample will behave in the same manner as the rest of your app’s users. This presents a problem with the test’s external validity.
3. Only one part on the funnel is tested: Organic users usually reach app pages through search or category rankings. In this kind of test, this step in the funnel is skipped. Both platforms have some sort of a solution for this, but it is not perfect.
Google Experiments – Random A/B Double Blind Testing
Google Experiments are easy to set up and are clean. You can read what we wrote about this platform when it first came out here.
As a clean and simple A/B test tool, one or more changes in the app page can be tested at a time. The platform tracks whether this resulted in any change in the conversion rate in the actual Google Play Store, with consideration of the statistical significance level.
Advantages:
1. Random test: Testing random subjects in their natural environment (Google Play Store) with no outside effects to influence the subjects’ behavior.
2. All traffic is being tested: Test takes place on all types of traffic – all sources of paid and organic.
3. Double blind trials: The subject doesn’t know he or she is being tested, and the tester is the software, which cannot be biased
4. Easy to set up: You can upload a test within two minutes. Read instructions from Google here.
Disadvantages and Risks:
1. Answers the what but not the why: You know what version works best, but you don’t get any feedback from users as to why it worked best. On the other hand, users seldom know why they acted the way they did. Also, the platform doesn’t provide any information besides conversion rates. But, at the end of the day, this is the only thing that really matters.
Our Way
At yellowHEAD, we prefer Google Experiments’ A/B testing for Google Play. We work alongside both Store Maven and Split Metrics for iOS tests. We have our own methodology of using the Experiments tool, which we will partially explain in a future blog post.

We are not strong believers in surveys – we believe this method is extremely incorrect and might hurt an app’s conversion rate by providing false data. Be wary of any platform that suggests app store surveys, but does not recommend Google A/B tests. They are most likely aware of their system’s poor external validity.
On a final note, we can say that choosing the right tools for analysis is a main key to ASO success.