Google is introducing new insights in the Google Play Developer Console that provide some useful benchmarking data points for analyzing organic user acquisition. The update is currently in beta and is only available to certain major apps. As the ASO service providers for a number of major apps that are part of the beta, we were able to take a closer look.
The new benchkmark feature specifically provides new insight on organic conversion rates within a category. As App Store Optimization experts, we believe this will be highly beneficial for developers in their optimization efforts. Our clients frequently ask us what a good and realistic conversion rate target is for an app in their category. This update allows us to figure this out and better gage an app’s performance against its competition. Furthermore, the new insights are available on a country level. This acts as a good indicator of the effectiveness of localization in each locale, a critical part of our ASO process. Countries showing relatively high conversion rates may indicate effective and accurate localization of the app’s store listing, while countries showing low conversion rates may require a re-evaluation and adjustment of the listing in that country.
A guide to the update:
In the User Acquisition page of the Google Play Developer Console, there is now a dropdown arrow for the “Play Store (organic)” acquisition channel. When dropped down, you will see a Conversion Rate Benchmarks chart like this (*conversion rates are blurred due to confidentiality of information):
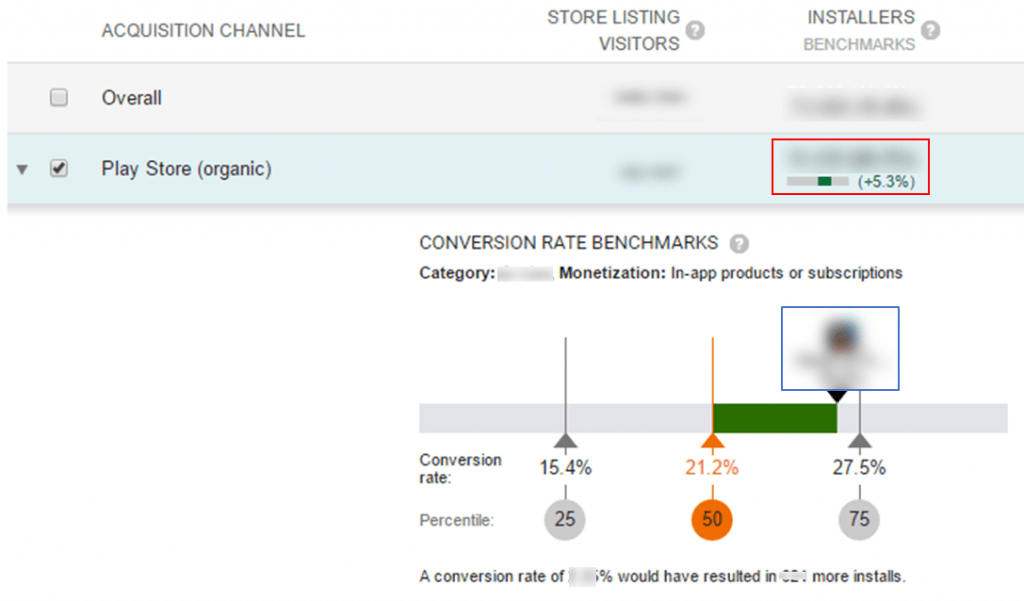
The chart breaks down the conversion rates for the entire category by percentiles in intervals of 25% and shows where your app’s conversion rate falls within its category. In the example above, the app (boxed in blue) falls in the 3rd quartile within the category for conversion rate in the Play Store. There is also an abbreviated view of this in the “Installers” column that shows your app’s conversion rate relative to the 50th percentile within the category (boxed in red). In the case above, we can see that the app’s organic conversion rate is 5.3% higher than 50% of the apps in its category.
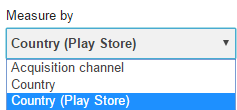
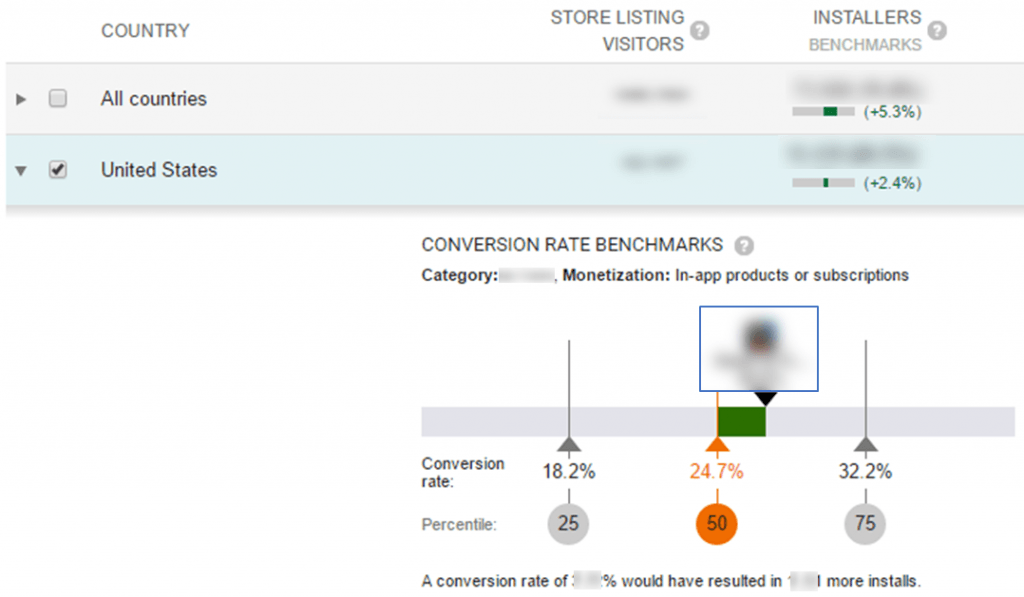
The update lets you dive even further into this analysis by providing the same data by country. In the “Measure by” dropdown in the User Acquisition page, there is now an option called “Country (Play Store)”.
On this page, you can now get the same benchmark chart as above for each individual country in which your app is listed.
Overall, this new update offers three major benefits:
- A basis for realistic conversion rate targets for your app
- A good indication of your app’s performance against the competition from a conversion perspective
- Helps narrow the focus of your ASO localization efforts
Again, this app is currently in beta for major apps, but stay tuned for the universal release and make sure you take advantage! Feel free to contact us with your questions on the update.
Post-Beta UPDATE:
The conversion rate benchmarking tool is available for all Google Play app developers. This is a great tool for understanding how your app is converting through different acquisition channels relative to other apps in its competition. It’s also a great way to track the progress of your optimization efforts.
There are a few of important things to keep in mind when using these benchmarks as part of your overall marketing and app store optimization strategy.
- The data used for benchmarking is gathered from all apps within one category (i.e. Casino). This means that the data may not be completely representative of your app. For example, the Casino category includes slots, poker, and jackblack games. If you are a slots app and want to know where your conversion stands against the category, keep in mind that the data you are comparing your app to includes conversion rates of other casino games like poker and blackjack. As an ASO agency that works with many apps across different categories, we requested that Google sample data from similar apps to the app being benchmarked, rather than just its entire category.
- The benchmarks are presented in percentage quartiles. This means that the orange “50” benchmark marks the median conversion rate of all apps in the category, not the average. The grey 25 and 75 intervals represent the 1st and 3rd quartiles, or the medians of the first and second halves of the data set respectively.
- Apps with major brand names will likely have higher conversion rates than minor apps and should aim to be towards the top quartile of the benchmark.
Stay tuned for more updated on the new features and feel free to contact us with any questions!