

Marketing success depends on data. Specifically, knowing how to measure what’s working. Whether your priority is expanding your user base, climbing search rankings, or increasing app installs, having a clear understanding of KPIs and metrics is non-negotiable.
This yellowHEAD special guide offers a practical, no-fluff approach to measuring performance across three essential areas: User Acquisition (UA), Search Engine Optimization (SEO), and App Store Optimization (ASO). You’ll get examples, tips, and best practices to help keep your strategy sharp, data-informed, and results-driven—with a focus on key performance indicators and key metrics and how they tie into real business impact.
What are key performance indicators and metrics in marketing?
Understanding the difference between KPIs and metrics is key to building a data-driven marketing strategy. While the two terms are often used interchangeably, they serve different roles in measuring performance.
Key performance indicators vs key metrics
To build a marketing strategy rooted in performance, it’s crucial to distinguish between key performance indicators and key metrics.
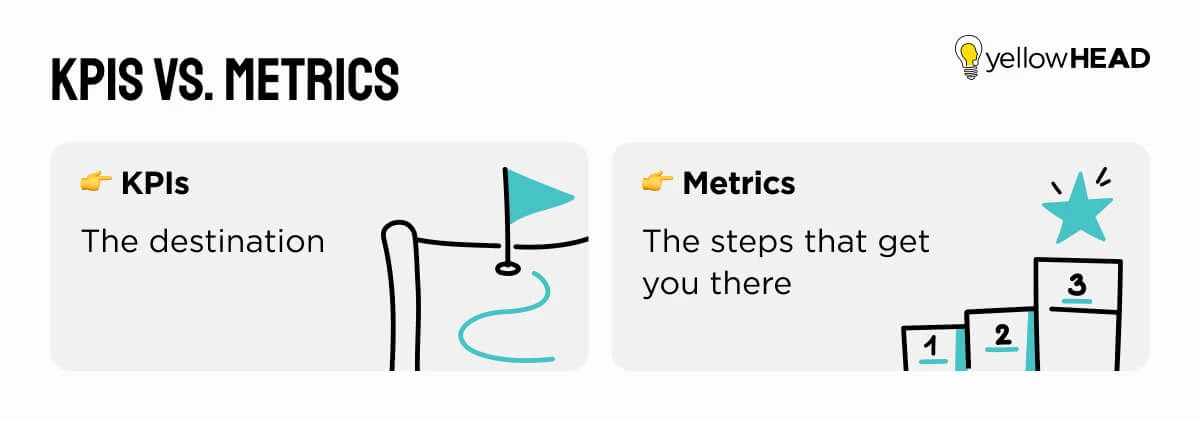
KPIs (Key Performance Indicators) are the high-level, strategic measures that track progress toward your business goals. Metrics are the supporting data that offer context and explain the “why” behind a KPI’s movement.
Wrike frames KPIs as indicators of success tied to goals, while RIB Software highlights how metrics reveal what’s happening under the hood. This fundamental difference between a KPI and a metric in marketing is essential to building effective campaigns and dashboards.
What makes a good KPI?
Effective KPIs aren’t just about numbers—they’re about focus. The best ones:
- Reflect broader marketing or business objectives
- Measure outcomes, not just activity
- Are clear, limited in number, and actionable
- Guide ongoing decision-making
How metrics support KPIs
Metrics help you:
- Understand user behavior and specific processes
- Pinpoint friction points and areas for growth
- Explain why a KPI is moving (or not)
Examples: How KPIs & metrics work together
These key metrics examples illustrate how each KPI is supported by multiple metrics that provide deeper insight into user behavior, campaign performance, and areas for optimization.
The following are key metrics examples that support high-level KPIs and provide context into what’s driving success, or where optimization is needed.
| KPI | Supporting Metrics |
|---|---|
| Customer Lifetime Value | Customer Acquisition Cost (CAC), Average Order Value (AOV), Purchase Frequency |
| Organic Traffic Growth | Keyword Rankings, Click-Through Rate (CTR), Organic Clicks |
| Install Rate | APP Store Impressions, Store Listing CTR, Installs |
| Conversion Rate | Landing Page Bounce Rate, Form Completion Rate, Cart Abandonment Rate |
User Acquisition (UA): The KPIs that really count
User acquisition sits at the core of any marketing strategy. Whether you’re running paid media, partnering with influencers, or optimizing landing pages, the mission stays the same: bring in new users and convert them efficiently.
Tracking the right KPIs helps you understand which channels deliver quality users, how much they cost, and how efficiently they move through your funnel.
| KPI | Metrics | Why It Matters |
|---|---|---|
| Customer Acquisition Cost (CAC) | Cost per Click (CPC), Cost per Mille (CPM), Click-Through Rate (CTR), Conversion Rate | Helps determine the efficiency of spend to acquire each new customer. |
| Lifetime Value (LTV) | Average Order Value (AOV), Purchase Frequency, Retention Rate, Churn Rate | Ensures acquired users are valuable in the long term and justify acquisition costs. |
| Return on Ad Spend (ROAS) | Revenue per User, Attribution Window Performance, Campaign-Level Revenue | Measures profitability of paid campaigns across platforms. |
| Conversion Rate | Bounce Rate, Time on Site, Form Completion Rate, Add-to-Cart Rate | Indicates how effectively campaigns turn users into customers or leads. |
| Retention Rate (D1, D7, D30) | Session Frequency, Uninstall Rate, Push Notification Engagement | Key for measuring post-acquisition value and predicting long-term revenue. |
By aligning your UA efforts with smart KPIs, you’re not just driving more users – you’re driving the right users. Whether you’re optimizing for Retention Rate or maximizing your ROAS, clear measurement makes all the difference.
Meta (Facebook & Instagram) Advertising
Meta’s ad platforms, especially Facebook and Instagram, offer a ton of precision when it comes to targeting and creative flexibility. But performance doesn’t just happen by luck. To stay ahead of fatigue, audience overlap, and rising ad costs, constant testing and optimization are key.
Tracking the right KPIs will help you fine-tune your facebook ad campaigns, allocate budget wisely, and avoid wasting spend on underperforming assets.
| KPI | Metrics | Why It Matters |
|---|---|---|
| Return on Ad Spend (ROAS) | CTR, CPM, Frequency | Measures the profitability of ad spend and reveals creative performance trends. |
| Cost per Acquisition (CPA) | Add-to-Cart Rate, Landing Page Conversion | Tracks efficiency of converting users per campaign or audience segment. |
| Customer Acquisition Cost (CAC) | Overall Spend / New Customers Acquired | Helps assess UA cost at a broader level beyond platform-specific metrics. |
| Conversion Rate | Thumbstop Rate, Page Load Speed | Indicates how effectively the ad funnel turns interest into action. |
yellowHEAD Tip: On platforms like Meta, creative ad fatigue is real—and it hits fast. Swapping in new visuals, experimenting with formats, and tailoring content to each platform’s user behavior can boost CTR and extend campaign performance.
TikTok advertising
TikTok has become a go-to channel for brands aiming to reach Gen Z and younger millennials. What makes it stand out is how trend-driven, native content consistently beats polished, traditional ads. On TikTok, success comes from authenticity, not production value.
To get results, it’s crucial to track KPIs that reflect real user behavior, like ROAS, Engagement Rate, and View-Through Conversions. Brands that thrive often embrace native-style formats, and standout examples ofTikTok ads reveal what truly resonates with the platform’s audience.
| KPI | Metrics | Why It Matters |
|---|---|---|
| ROAS | Video Completion Rate, CTR, Spark Ad Engagement | Evaluates how effective TikTok ads are at turning views into revenue. |
| Customer Acquisition Cost (CAC) | CPM, Video Watch Time | Assesses campaign efficiency per new user acquired. |
| Engagement Rate | Likes, Shares, Saves, Comments | Measures content resonance with TikTok’s community. |
| Video View-Through Conversions | View % Benchmarks, Attribution Window | Tracks conversions tied to users who watched (but didn’t immediately click). |
Programmatic Advertising: Data-Driven at scale
Programmatic advertising offers the holy grail of scale, efficiency, and hyper-targeted delivery. But with that power comes complexity. To get a strong return, marketers need to keep a close eye on the right KPIs, especially those tied to placement quality, frequency control, and audience segmentation.
| KPI | Metrics | Why It Matters |
|---|---|---|
| CAC | Impression Share, CPM, Frequency Capping | Indicates cost-efficiency and controls overreach or ad fatigue. |
| Viewability Rate | Creative Engagement, Placement Quality | Shows if ads are actually seen, not just served. |
| Conversion Rate | Landing Page CTR, Retargeting CTR | Measures how well programmatic drives meaningful user actions. |
| Retargeting ROAS | Click Map Heatmaps, Session Depth | Evaluates the profitability of bringing back warm users through retargeting. |
UA web campaigns (Paid Search & Landing Pages)
Paid search campaigns are powerful when it comes to capturing high-intent traffic. But intent alone doesn’t guarantee conversions. To drive results, you need tightly aligned keyword targeting, relevant Google ad types, and landing pages that deliver a smooth, convincing user experience.
| KPI | Metrics | Why It Matters |
|---|---|---|
| Conversion Rate | Form Completion Rate, Bounce Rate, Page Load Speed | Measures how well high intent users convert into leads or customers. |
| CPA | Keyword Quality Score, CPC | Tracks the cost of acquiring each user via paid search or landing page. |
| Bounce Rate | Time on Site, Scroll Depth | Reveals content or UX mismatches that lose users early. |
| Quality Score (Google Ads) | Ad Relevance, Landing Page Experience | Impacts ad placement, cost-efficiency, and visibility in search results. |
Display advertising: Awareness meets acquisition
Display advertising is a bit of a hybrid. On one hand, it builds awareness through eye-catching visuals. On the other, it supports performance by retargeting interested users and guiding them back into the funnel.
To make display ads work, you need to go beyond impressions. The real value lies in understanding how well those impressions translate into engagement, clicks, and conversions.
| KPI | Metrics | Why It Matters |
|---|---|---|
| View-Through Conversions | Post-View Conversion Rate, Session Duration | Captures the impact of ads users saw but didn’t click. |
| CAC | CTR, Frequency, Placement Type | Shows how effectively display ads are driving new users at scale. |
| Retargeting ROAS | Impressions, Audience Segment Performance | Tracks profitability of re-engaging previously interested users. |
| CTR | Creative Engagement, Ad Format Testing | Measures how well visuals and copy draw user attention. |
Display is most effective when paired with retargeting strategies and creative that feels personalized. Controlling frequency ensures your ads don’t annoy users, while format testing can reveal which visuals are actually breaking through the noise.
SEO: KPIs and metrics for organic growth
Search Engine Optimization is a long-term play, but when it’s done right, it delivers sustainable traffic and some of the highest-margin conversions. The key is to focus not just on rankings, but on the performance indicators that reveal how your content is actually driving value.
With the right KPIs, you can measure how visible your site is in search results, how users engage with your pages, and how effectively those visits convert into business outcomes.
| KPI | Metrics | Why It Matters |
|---|---|---|
| Organic Traffic | Total visits from unpaid search; Keyword Rankings; Backlink Profile | It’s the clearest signal of your search visibility and shows how well your SEO efforts attract visitors. |
| Organic Conversion Rate | Landing page conversion rate; Form Submission Rate; Purchase or Lead Completion Rate | This KPI reveals how effectively your organic visitors are completing desired actions, proving the quality of your traffic. |
| Click-Through Rate (CTR) | SERP meta title & description performance; Rich/Featured Snippets; Ad-like copy test results | A higher CTR indicates that your listings are compelling, leading to more clicks and, potentially, improved rankings. |
yellowHEAD Tip: Rather than obsessing over vanity metrics like impressions or rank position alone, smart SEO measurement focuses on user behavior and outcomes. After all, ranking #1 doesn’t mean much if no one’s clicking, or if those who do bounce immediately.
By aligning your SEO goals with meaningful KPIs, your team can better prioritize content, identify technical issues, and continuously improve how organic traffic contributes to the bottom line.
ASO: KPIs and metrics for app visibility and installs
App Store Optimization (ASO) helps your app get discovered, convert store page visitors, and drive more installs. But visibility is just one piece of the puzzle, tracking the right KPIs ensures your store listing is actually performing.
| KPI | Metrics | Why It Matters |
|---|---|---|
| App Store Ranking | Keyword Visibility, Category Position, Trending Position | Indicates how discoverable your app is for key search terms—higher rankings lead to more visibility and organic traffic. |
| Install Rate | View-to-Install Rate, Browse-to-Install Rate, CTR on App Listings | Measures how effectively your store listing converts views into installs—a key sign of strong messaging and visuals. |
| Conversion Rate (CVR) | A/B Test Results (icons, screenshots, videos), Ratings, Reviews | Reflects how well your listing resonates with users; essential for improving install efficiency. |
| Retention Rate (D1/D7) | Uninstall Rate, Session Frequency, In-App Behavior | Tells you if users are sticking with your app post-install—important for understanding LTV and engagement. |
Bonus metrics to watch:
- Impressions & Traffic Sources – Help you understand where users are discovering your app (search, browse, or external referrers).
- Rating & Review Trends – Offer insight into user sentiment and impact both conversion rates and algorithmic ranking.
- Keyword Visibility – Tracks how well your app ranks across targeted search terms, helping you stay competitive in key categories.
Consistently tracking the right ASO KPIs helps ensure your store presence isn’t just visible, but also effective at converting views into long-term value.
How to choose and implement the right KPIs
Choosing the right KPIs isn’t just about tracking what’s easy, it’s about measuring what actually matters. To ensure your KPIs drive meaningful performance insights, follow these foundational steps:
1. Align KPIs with business goals
Begin by mapping your KPIs to what actually matters to your business. Are you focused on acquisition, retention, revenue growth—or all three?
- If you’re focused on customer retention, KPIs like LTV and churn rate are critical.
- If your priority is scaling acquisition, zero in on CAC, ROAS, and conversion rates.
- Different platforms call for different KPIs—what works for Instagram Ads may not apply to Google Ads or TikTok.
2. Define SMART KPIs
To stay focused and accountable, ensure your KPIs are:
- Specific – Clear and well-defined
- Measurable – Based on accessible, trackable data
- Achievable – Realistic within your team’s resources
- Relevant – Aligned with your broader objectives
- Time-bound – Tracked within a defined timeframe
SMART KPIs give teams clarity, consistency, and alignment—so no one’s guessing what success looks like.
3. Build reliable data pipelines
The best KPIs are only as good as the data behind them. Make sure your analytics tools are accurate, consistent, and able to scale with your needs.
- Google Analytics – Ideal for website and app traffic
- Mixpanel – Great for behavior funnels and retention
- Amplitude – Perfect for user-level product insights
Clean data is essential for building trust in your performance reporting.
4. Set benchmarks and a review cadence
Tracking is only useful when it’s compared to a baseline. Use historical data or industry standards to establish benchmarks and set review timelines.
- Weekly or bi-weekly – For campaign-level KPIs
- Monthly or quarterly – For strategic, high-impact KPIs
Regular reviews help spot shifts early and keep your team proactive, not reactive.
Building dashboards that actually drive action
KPI dashboards aren’t just for data display, they should help teams make faster, smarter decisions. The best ones are visual, focused, and built with specific stakeholders in mind.
Here’s what separates effective dashboards from digital noise:
- Keep it clean and visual – Use charts, scorecards, and graphs to highlight trends at a glance
- Tailor by team – Customize views for marketers, execs, product, and growth teams
- Use the right tools – Platforms like Looker Studio, Databox, or Geckoboard make it easy to build dashboards that update in real-time
Reporting Cadence: Timing Is Everything
- Campaign KPIs should be reviewed daily or weekly to spot performance shifts and respond fast
- Strategic KPIs (like retention, LTV, or ROAS) should be reviewed monthly or quarterly for longer-term planning
Custom reporting with yellowHEAD
At yellowHEAD, each department—UA, SEO, ASO, and Creative—operates with its own tailored reporting dashboard, built around your specific KPIs. These custom dashboards offer a clear, data-rich view into your key metrics, making it easy to drill down into campaign details and understand how your metrics and KPIs align with business objectives. Whether you’re tracking acquisition cost, keyword lift, or retention patterns, our real-time insights help uncover what’s working and where to optimize.

Real-World Results:Driving RPG growth with Spark Ads on TikTok
yellowHEAD partnered with a top-tier RPG mobile game to launch a high-impact user acquisition campaign using TikTok’s Spark Ads format. By leveraging organic creator content and amplifying it through paid promotion, the team was able to drive authentic engagement while scaling reach.
Through precise targeting, creative optimization, and real-time performance monitoring, the campaign delivered a significant lift in installs and in-app engagement, demonstrating TikTok’s power not just for awareness, but for actionable growth in the gaming vertical.
Final thoughts
The right KPIs are more than just performance numbers, they’re essential tools for aligning teams, driving accountability, and accelerating growth. When you clearly differentiate between KPIs and supporting metrics, tailor them to each marketing channel (whether it’s UA, SEO, or ASO), and track them consistently, your team is empowered to make smarter decisions, move faster, and deliver real, measurable results.
Ready to build a smarter reporting strategy? Get in touch with yellowHEAD to see how our customized dashboards and performance frameworks can help you turn data into impact.


